Okahu
How to enable Okahu monitoring for your genAI application
This document describes the steps to enable Okahu tracing in your GenAI application. With that your application will send the traces to Okahu SAS endpoint where they can be viewed and used by Okahu to maintain the application details and generate insights.
Supported app configurations
Programming language
- Python
GenAI Application frameworks
- Langchain
- LlamaIndex
- Haystack
Application hosting platforms
- Laptop/VM/VS Code
- Github code spaces
- Azure Functions
- Azure ML
- AWS Lambda Function
Getting Started
Create Okahu tenant
The first step is to create your tenant in Okahu. You can do this directly at www.okahu.ai. Login with email or social accounts and follow instructions on Try Okahu
Obtain Okahu API key
Once you have tenant created, login to okahu portal and navigate to Setup. Then click on Generate API Key. This will provide you the API key that you should save.
How to enable Okahu tracing in your AI application
To enable your application sending traces to Okahu cloud, you need two basic steps
- Your python application code is enabled to generate and send traces to Okahu cloud service. This is done by simply importing Okahu library in your app code and calling just one Okahu API in start of your application. You can alternative add that logic in the wrapper module. Please see the high level overview here. The specific steps for each supported application hosting environment are listed below.
- Add Okahu python library and API key in your applications runtime environment. The python library is available on Okahu’s Pypi compatible repository. There’s also an SDK packaged for ease of deployment if the using AWS Lambda function for application hosting. The sections below provides detail steps for each supported application hosting environment.
Supported Hosting environments
- Laptop/VS Code
- VM/ Github code spaces
- Azure Functions
- Azure ML
- AWS Lambda Function
App running on Laptop/local dev environment
Direclty install Okahu python SDK
If in local development environment like laptop, you are installing Python libraries directly using pip tool, then install Okahu SDK library from Okahu Pypi compatible repository -
> pip install --extra-index-url=https://okahu.jfrog.io/artifactory/api/pypi/okahu-pypi/simple okahu-observability
Add Okahu python SDK to dependency list
- If you are listing your applications python dependencies in the
requirements.txtfile, then add following lines at the top of your file--extra-index-url https://okahu.jfrog.io/artifactory/api/pypi/okahu-pypi/simple okahu-observability - Reinstall the dependencies using
pip install - requirements.txt
Provide Okahu API Key
- Make sure you have the Okahu API key extracted per above instructions
- Set an environment variable
OKAHU_API_KEYto the Okahu API key in your application runtime
Enable Okahu tracing in your python application code
- Follow the steps here to enable Okahu tracing in your application.
Test the changes
Test and validate that application traces going to your Okahu tenant.
App running on Cloud VM or Github code spaces
Direclty install Okahu python SDK
In local development environment like laptop, you can install Okahu SDK library releases from Okahu Pypi compatible repository
> pip install --extra-index-url=https://okahu.jfrog.io/artifactory/api/pypi/okahu-pypi/simple okahu-observability
Add Okahu python SDK to dependency list
- If you listing your other python dependencies in the
requirements.txtfile, then add following lines at the top of your file--extra-index-url https://okahu.jfrog.io/artifactory/api/pypi/okahu-pypi/simple okahu-observability - Reinstall the dependencies using
pip install -r requirements.txt
Provide Okahu API Key
- Make sure you have the Okahu API key extracted per above instructions
- Set an environment variable
OKAHU_API_KEYto the Okahu API key in your application runtime - For the app is hosted in Github codespace, you can also set the env variable via devcontainer setup
- For the app is hosted in Github codespace, you can also use Github secrets to store the Okahu API along with your other secrets/keys. Create a new secret with name
OKAHU_API_KEYand value Okahu API key. For details steps about creating secrets, please refer to Github documentation
Enable Okahu tracing in your python application code
- Follow the steps here to enable Okahu tracing in your application.
Test the changes
Test and validate that application traces going to your Okahu tenant.
App hosted in Azure Function
This section provides details of enabling Okahu tracing when the application code is hosted in Azure Functions.
Add Okahu python SDK to runtime environment
- Locate the
requirements.txtfile in the source code used by your application - Add following lines at the top of that file
--extra-index-url https://okahu.jfrog.io/artifactory/api/pypi/okahu-pypi/simple
okahu-observability
Provide Okahu API Key
- Make sure you have the Okahu API key extracted per above instructions
- Add the env variable
OKAHU_API_KEYin the Azure Function Environment Variables setting on the Azure Portal.
Enable Okahu tracing in your python application code
- Follow the steps here to enable Okahu tracing in your application.
Network considerations
The AI application enabled with Okahu will send the traces to Okahu cloud. Also the Okahu python library is downloaded from Okahu’s Pypi compatible repository. If your Azure environment is behind a firewall or a virtual network, then it might have blocked the network rout to the aforementioned endpoints. For the Okahu application tracing to work, we need following -
- The outbound https port (443) to ingest.okahu.co should be open for Azure Function hosting the application.
- The outbound https port (443) to okahu.jfrog.io should be open for Azure Function hosting the application. Please follow the relevent steps in your network configuration or contact your cloud/network/security admins to make the these changes.
Redeploy code
- Redeploy your application to your Azure Function with the same mechanism you use for deployment. Enabling Okahu will work with all Azure function deployment options
Test the changes
Test and validate that application traces going to your Okahu tenant.
App hosted in Azure ML
Add Okahu python SDK to runtime environment
- Locate your Conda env.yml in your application source.
- Add following at the top of pip dependencies section in env.yml
```
dependencies:
- pip:
- ’–extra-index-url https://okahu.jfrog.io/artifactory/api/pypi/okahu-pypi/simple’
- okahu-observability
```
Provide Okahu API Key
- pip:
- Make sure you have the Okahu API key extracted per above instructions
- Set the OKAHU_API_KEY in your AzureML code, like below in Python
os.environ["OKAHU_API_KEY"]="<okahu-api-key>"Enable Okahu tracing in your python application code
- Follow the steps here to enable Okahu tracing in your application.
Network considerations
The AI application enabled with Okahu will send the traces to Okahu cloud. Also the Okahu python library is downloaded from Okahu’s Pypi compatible repository. If your Azure environment is behind a firewall or a virtual network, then it might have blocked the network rout to the aforementioned endpoints. For the Okahu application tracing to work, we need following -
- The outbound https port (443) to ingest.okahu.co should be open for Azure Function hosting the application.
- The outbound https port (443) to okahu.jfrog.io should be open for Azure Function hosting the application. Please follow the relevent steps in your network configuration or contact your cloud/network/security admins to make the these changes.
Redeploy code
- Redeploy your application to Azure ML
Test the changes
Test and validate that application traces going to your Okahu tenant.
App hosted in AWS Lambda Function using SAM deployment
Add Okahu python SDK to runtime environment
- Locate the
requirements.txtfile used by your application - Add following line at the top of your
requirements.txtfile--extra-index-url https://okahu.jfrog.io/artifactory/api/pypi/okahu-pypi/simple okahu-observability
Enable Okahu tracing in your python application code
- Follow the steps here to enable Okahu tracing in your application.
Provide Okahu API Key
- Okahu API key extracted per above instructions
- To set In the sam template of your function add the environment variables of your template.yaml
Resource:
    ...
    Properties:
        ...
        Environment:
            Variables:
                OKAHU_API_KEY: <okahu-api-key>
Network considerations
The AI application enabled with Okahu will send the traces to Okahu cloud. If your AWS environment is behind a firewall or a VPC, then it might have blocked the network rout to the aforementioned endpoints. For the Okahu application tracing to work, we need following -
- The outbound https port (443) to ingest.okahu.co should be open for Lambda Function hosting the application. Please follow the relevent steps in your network configuration or contact your cloud/network/security admins to make the these changes.
Redeploy code
Test the changes
Test and validate that application traces going to your Okahu tenant.
App hosted in AWS Lambda Function using layer deployment
Add Okahu python SDK to runtime environment
When your application is deployed using the Lambda Layers, you need to create a add Okahu SDK library as a new layer to your Lambda function.
- Download latest AWS Lambda layer zip file https://okahu.jfrog.io/artifactory/Okahu-lamda-layer/
- Create new layer in your GenAI application lambda and upload the Okahu layer zip file. Please refer to AWS lambda layer management steps for deploying layers
Provide Okahu API Key
- Navigate to Configuration option in your GenAI lambda function
- Goto Environment Variable section and click EDIT
- Add new environment variable
OKAHU_API_KEYand set value to API key extracted per above instructions
Enable Okahu tracing in your python application code
- Follow the steps here to enable Okahu tracing in your application.
Network considerations
The AI application enabled with Okahu will send the traces to Okahu cloud. If your AWS environment is behind a firewall or a VPC, then it might have blocked the network rout to the aforementioned endpoints. For the Okahu application tracing to work, we need following -
- The outbound https port (443) to ingest.okahu.co should be open for Lambda Function hosting the application. Please follow the relevent steps in your network configuration or contact your network/security admins to make the these changes.
Redeploy code
- Save the changed python files changed for Okahu tracing. Click ‘Deploy’ to deploy the updates to your Lambda function.
Test the changes
Test and validate that application traces going to your Okahu tenant.
How to enable Okahu tracing in Python Apps
Instrument app code
You simply add a couple of lines of code in your application to initiate the Okahu tracing. Just import the Okahu observability package and invoke the API setup_okahu_telemetry(workflow=<workflow-name>) to enable the tracing. The workflow-name is what you define to identify the give application workflow, for example customer-chatbot. Okahu trace will include this name in every trace.
Example - Add Okahu tracing in your application
from okahu_apptrace.instrumentor import setup_okahu_telemetry

# Call the setup Okahu telemetry method
setup_okahu_telemetry(workflow_name = "my_chatbot_workflow")
...
Wrap app code
Alternately, you can create a new wrapper python scrip that setups up Okahu tracing as described in previous section, and call your applications main method from this new script. In this approach, you don’t need to touch your application code.
Example - Wrap Okahu tracing over your application
from okahu_apptrace.instrumentor import setup_okahu_telemetry
import my_chatbot

def main():
    # Call the setup Okahu telemetry method
    setup_okahu_telemetry(workflow_name = "my_chatbot_workflow")

    # Invoke main method of your app
    my_chatbot.main()

if __name__ == "__main__":
    main()
Test and verify Okahu tracing
Test the new deployment
Run your application as you run normally. Make sure you at least go through 2-3 iterations. For example, if this is chatbot app then go through a few questions and answers.
Verify that application is sending traces to Okahu cloud
To verify the tracing is working, we’ll make Okahu examine new traces and discover the new workflow. We’ll follow the steps to add a new application which will trigger this.
- Login to Okahu portal.
- Click on ‘New Application’. This will bring up new application creation form.
- Click on the ‘Browse Discovered Components’ under the ‘Components’ section. This will bring up the list of known components.
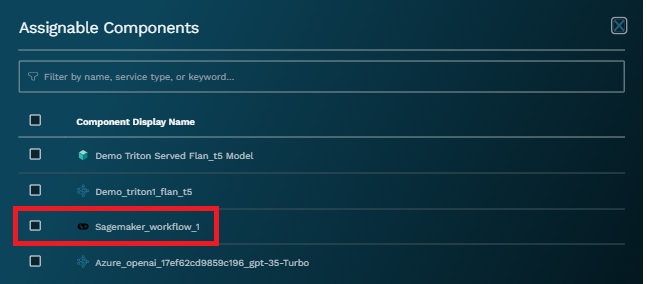
- The
workflow-namethat’s set in your application as part of Okahu API should show up in the component list. - Click ‘Cancel’ to abort adding application.
Troubleshooting
Error in installing the Okahu SDK library
Make sure that you have network path open to Okahu’s Pypi compatible repository. Verify the connectivity by running nslookup -port=443 okahu.jfrog.io
The verification steps didn’t show the configured workflow name
If the workflow-name is not there in the list of components per the validation steps mentioned above, Okahu is not receiving traces from your application.
- Verify that you have set the correct API key for your Okahu tenant per the instructions for your application host environment
- Make sure that you have network path open to Okahu’s trace ingestion endpoint. Verify the connectivity by running
nslookup -port=443 ingest.okahu.io. If there’s not network path, please contact your cloud/network/security admins to enable it.Report issues to Okahu team
Please send a email to cx@okahu.ai
Know issues
Issues in sending traces from AWS Lambda functions
For an app hosted in AWS Lambda function, in some cases the execution of Lambda function is terminated before Okahu SDK can complete sending the traces. We are working on fixing this in the upcomping version of Okahu SDK. To metigate the issue, add an extra delay at the end of your application
time.sleep(10)