VS Code Extension
The Okahu AI Observability extension lets you trace, visualize, and debug AI agent workflows without leaving your IDE. It works with any agentic framework (Google ADK, LangGraph, OpenAI Agent SDK, AWS Strands, CrewAI, and more) running locally or in the cloud.
Key capabilities:
- Trace visualization -- View agent execution as a hierarchical tree, Gantt timeline, or narrative graph
- Span inspection -- Click any span to see inputs, outputs, token counts, latency, and errors
- Cloud integration -- Connect to Okahu Cloud, AWS S3, or Azure Blob Storage for production traces
- AI chat agent -- Ask
@okahuin VS Code Chat to analyze errors, performance, and run evaluations - Auto-instrumentation -- Right-click Python or TypeScript files to add Monocle tracing with one click
- LLM evaluations -- Run evaluations on cloud traces to assess sentiment, relevance, and custom criteria
- Built on open source -- Uses Monocle from the Linux Foundation, compatible with OpenTelemetry
Installation
Test and debug AI agents with full trace observability, directly inside VS Code.
VS Code
- Open VS Code
- Go to Extensions (
Cmd+Shift+X/Ctrl+Shift+X) - Search for "Okahu AI Observability"
- Click Install
Install from VS Code Marketplace
Cursor, Kiro, Antigravity, and Other IDEs
For VS Code-compatible IDEs that use the Open VSX registry:
- Open your IDE's extension manager
- Search for "Okahu AI Observability"
- Click Install
Verify Installation
Open the Command Palette (Cmd+Shift+P / Ctrl+Shift+P) and type "Okahu". You should see:
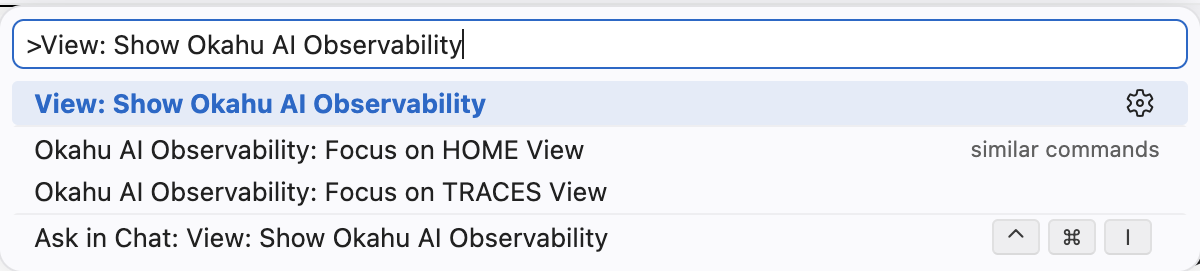
Select "View: Show Okahu AI Observability" to open the extension sidebar.
Getting Started
Step 1: Open the Sidebar
Click the Okahu icon in the Activity Bar (left sidebar) or use the Command Palette. You'll see two sections:
- TRACES -- Where your local and cloud traces appear
- HOME -- Quick links to documentation, examples, and community resources
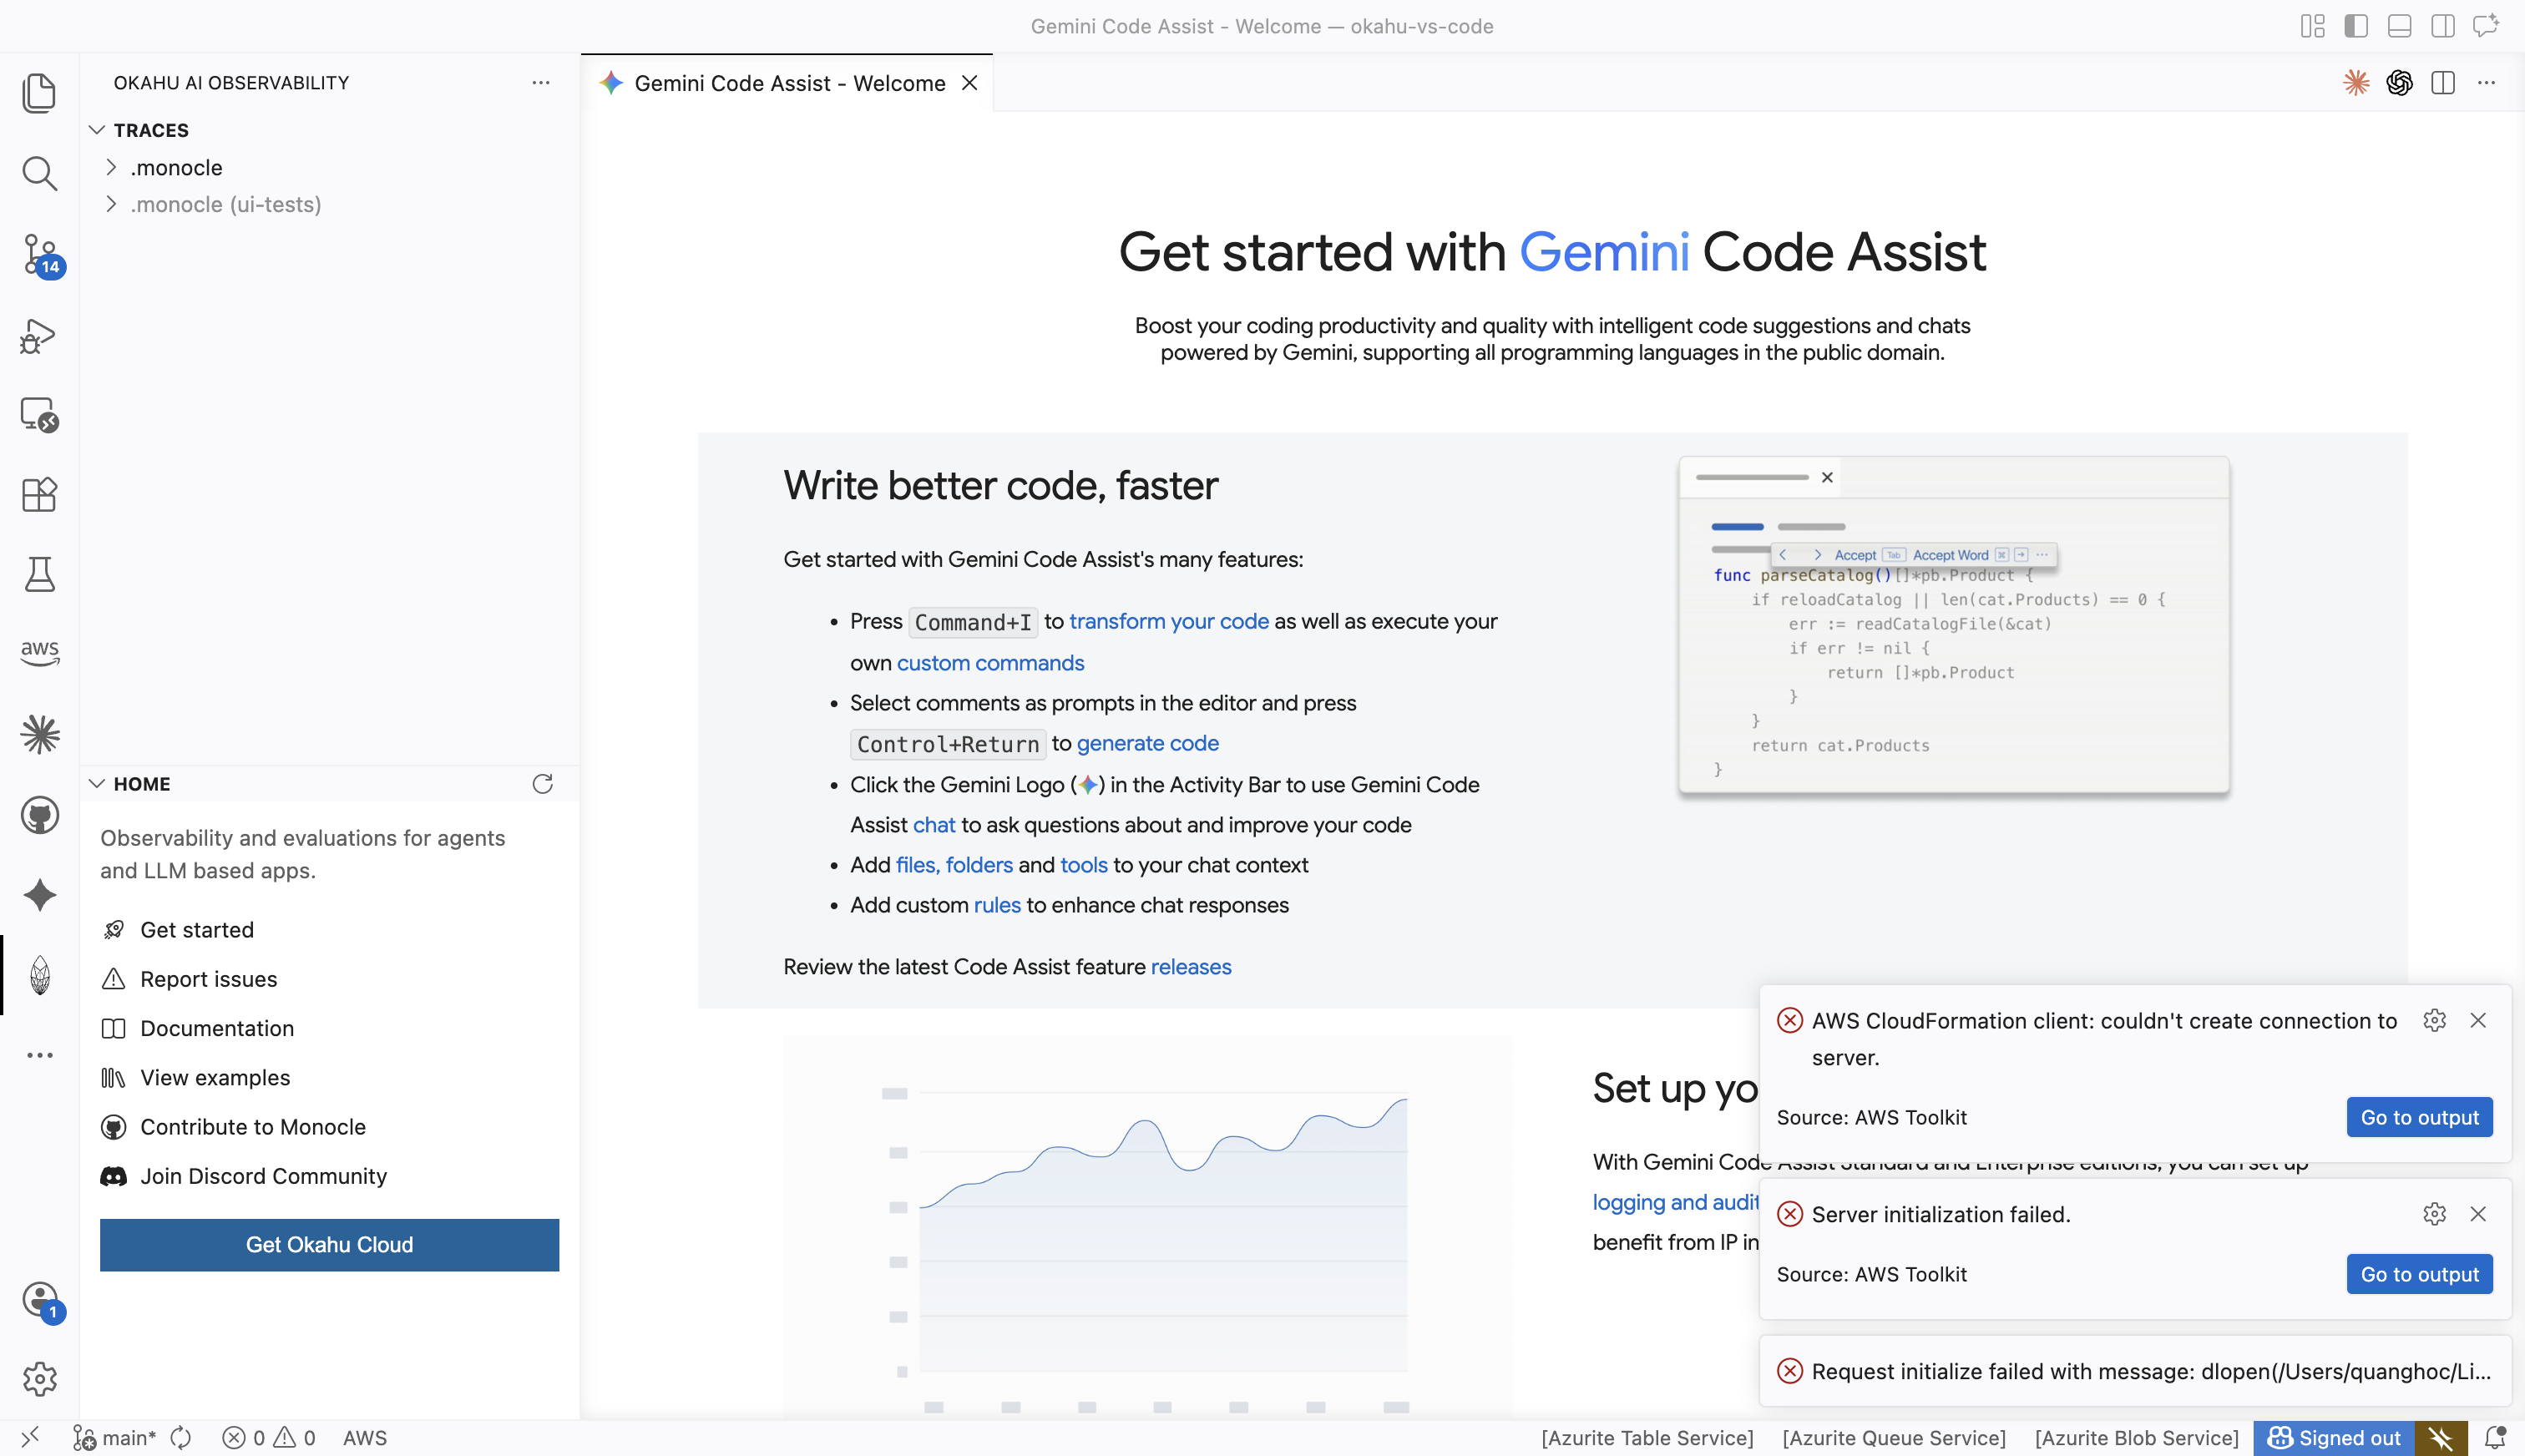
The HOME section provides:
- Get started -- Link to docs.okahu.ai
- Report issues -- Link to help.okahu.ai
- View examples -- Demo repositories on GitHub
- Contribute to Monocle -- Open source project at monocle2ai.org
- Join Discord Community -- discord.gg/D8vDbSUhJX
- Get Okahu Cloud -- Sign up at portal.okahu.co
Step 2: Instrument Your Agent Code
Right-click inside any Python or TypeScript file and select the Monocle submenu:
For Python:
- Enable Monocle for Python -- Adds
monocle_apptraceimport and setup to your file - Run Python with Monocle -- Creates a run configuration that traces your script
For TypeScript:
- Enable Monocle for TypeScript -- Adds
monocle2aiimport and setup
This adds tracing instrumentation. When your agent runs, trace data is saved to a .monocle/ folder in your workspace.
Step 3: Run Your Agent
Run your instrumented agent code. Trace files (JSON) appear automatically in the .monocle/ folder. The extension watches this folder and updates the TRACES sidebar in real time.
Step 4: View Traces
Expand the .monocle folder in the TRACES sidebar to see your trace files:
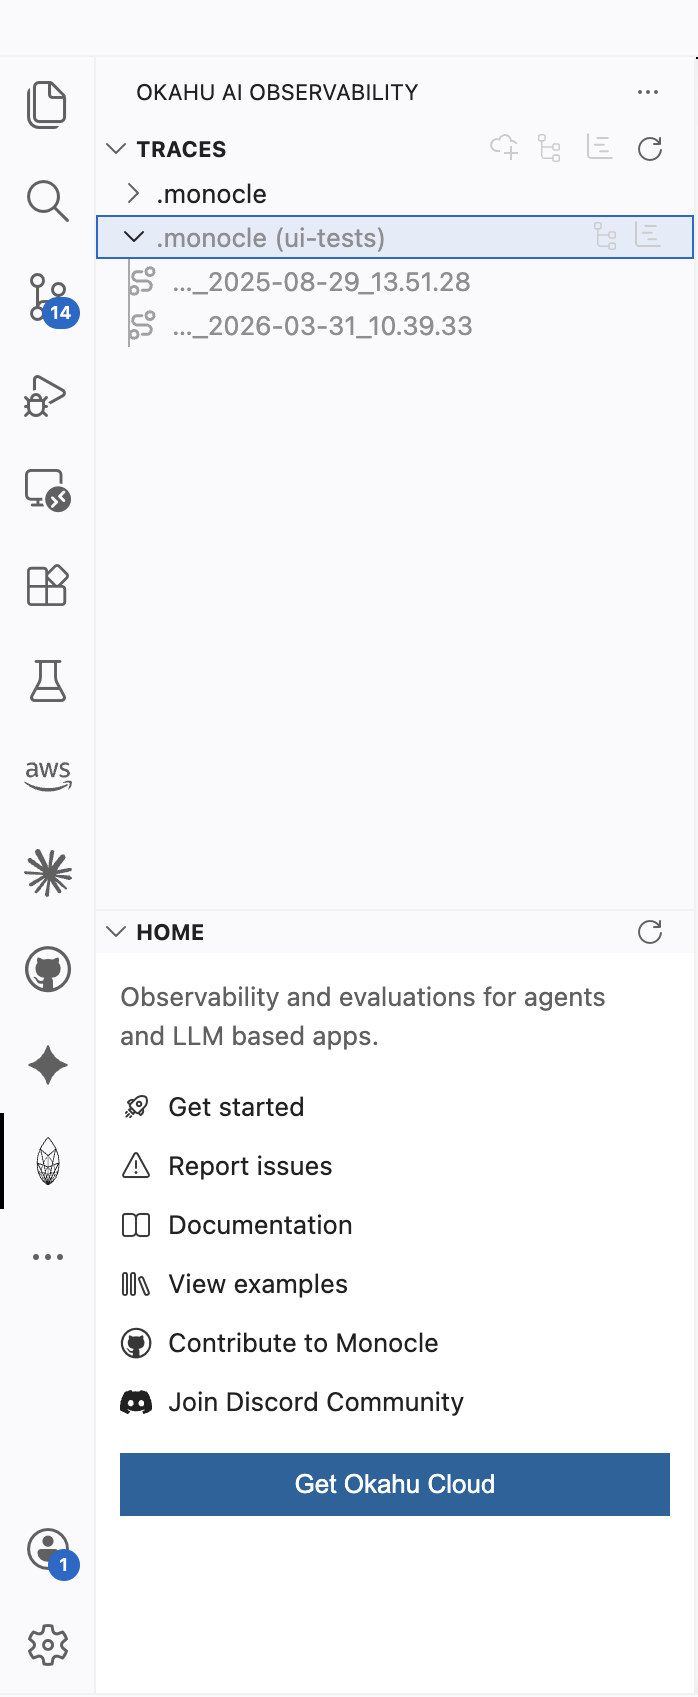
Click any trace to open the visualization panel.
Trace Visualization
The extension provides three visualization modes, switchable via toolbar buttons at the top of the TRACES view.
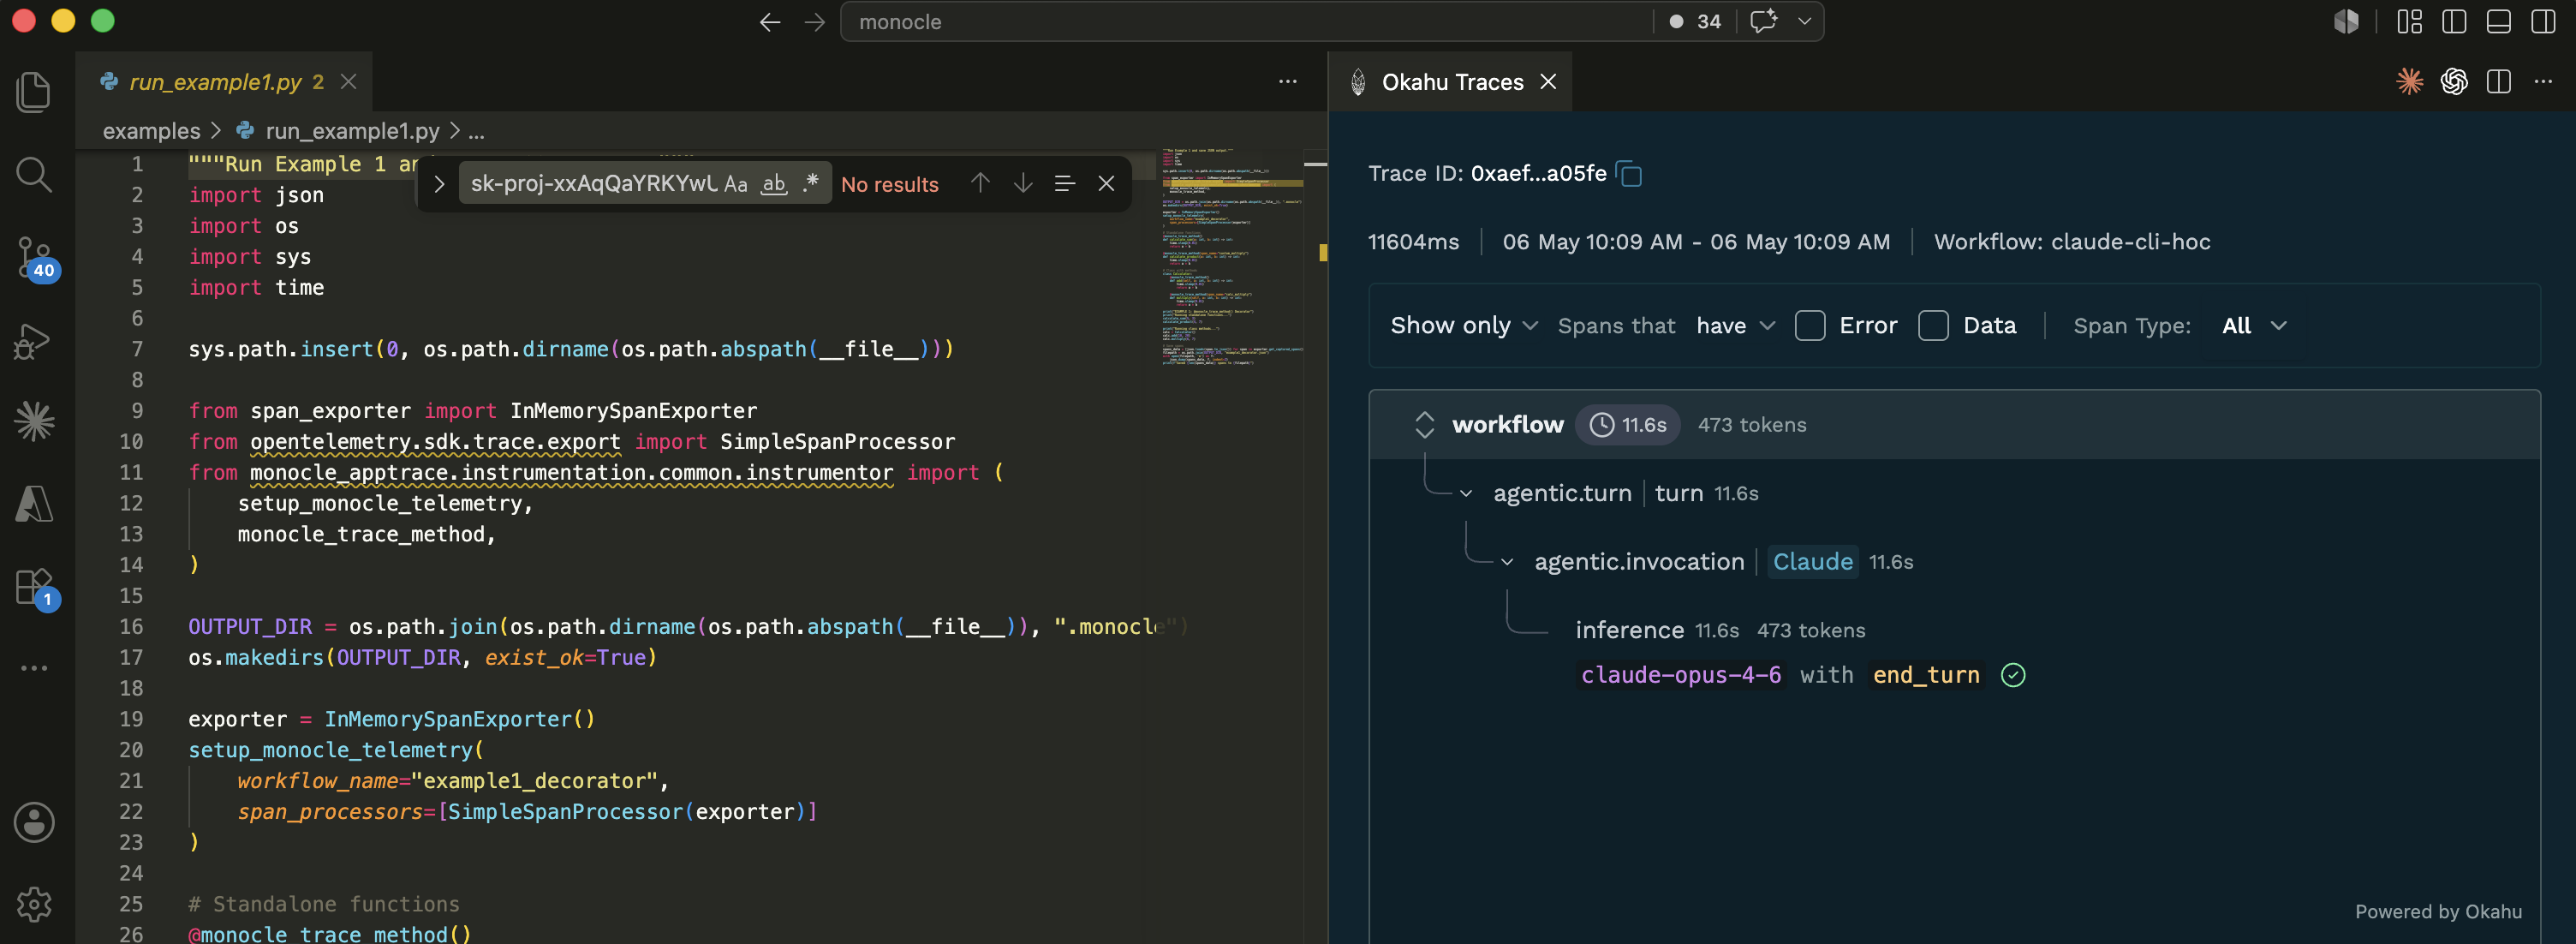
Tree View
The default view. Shows the hierarchical parent-child relationships between spans.
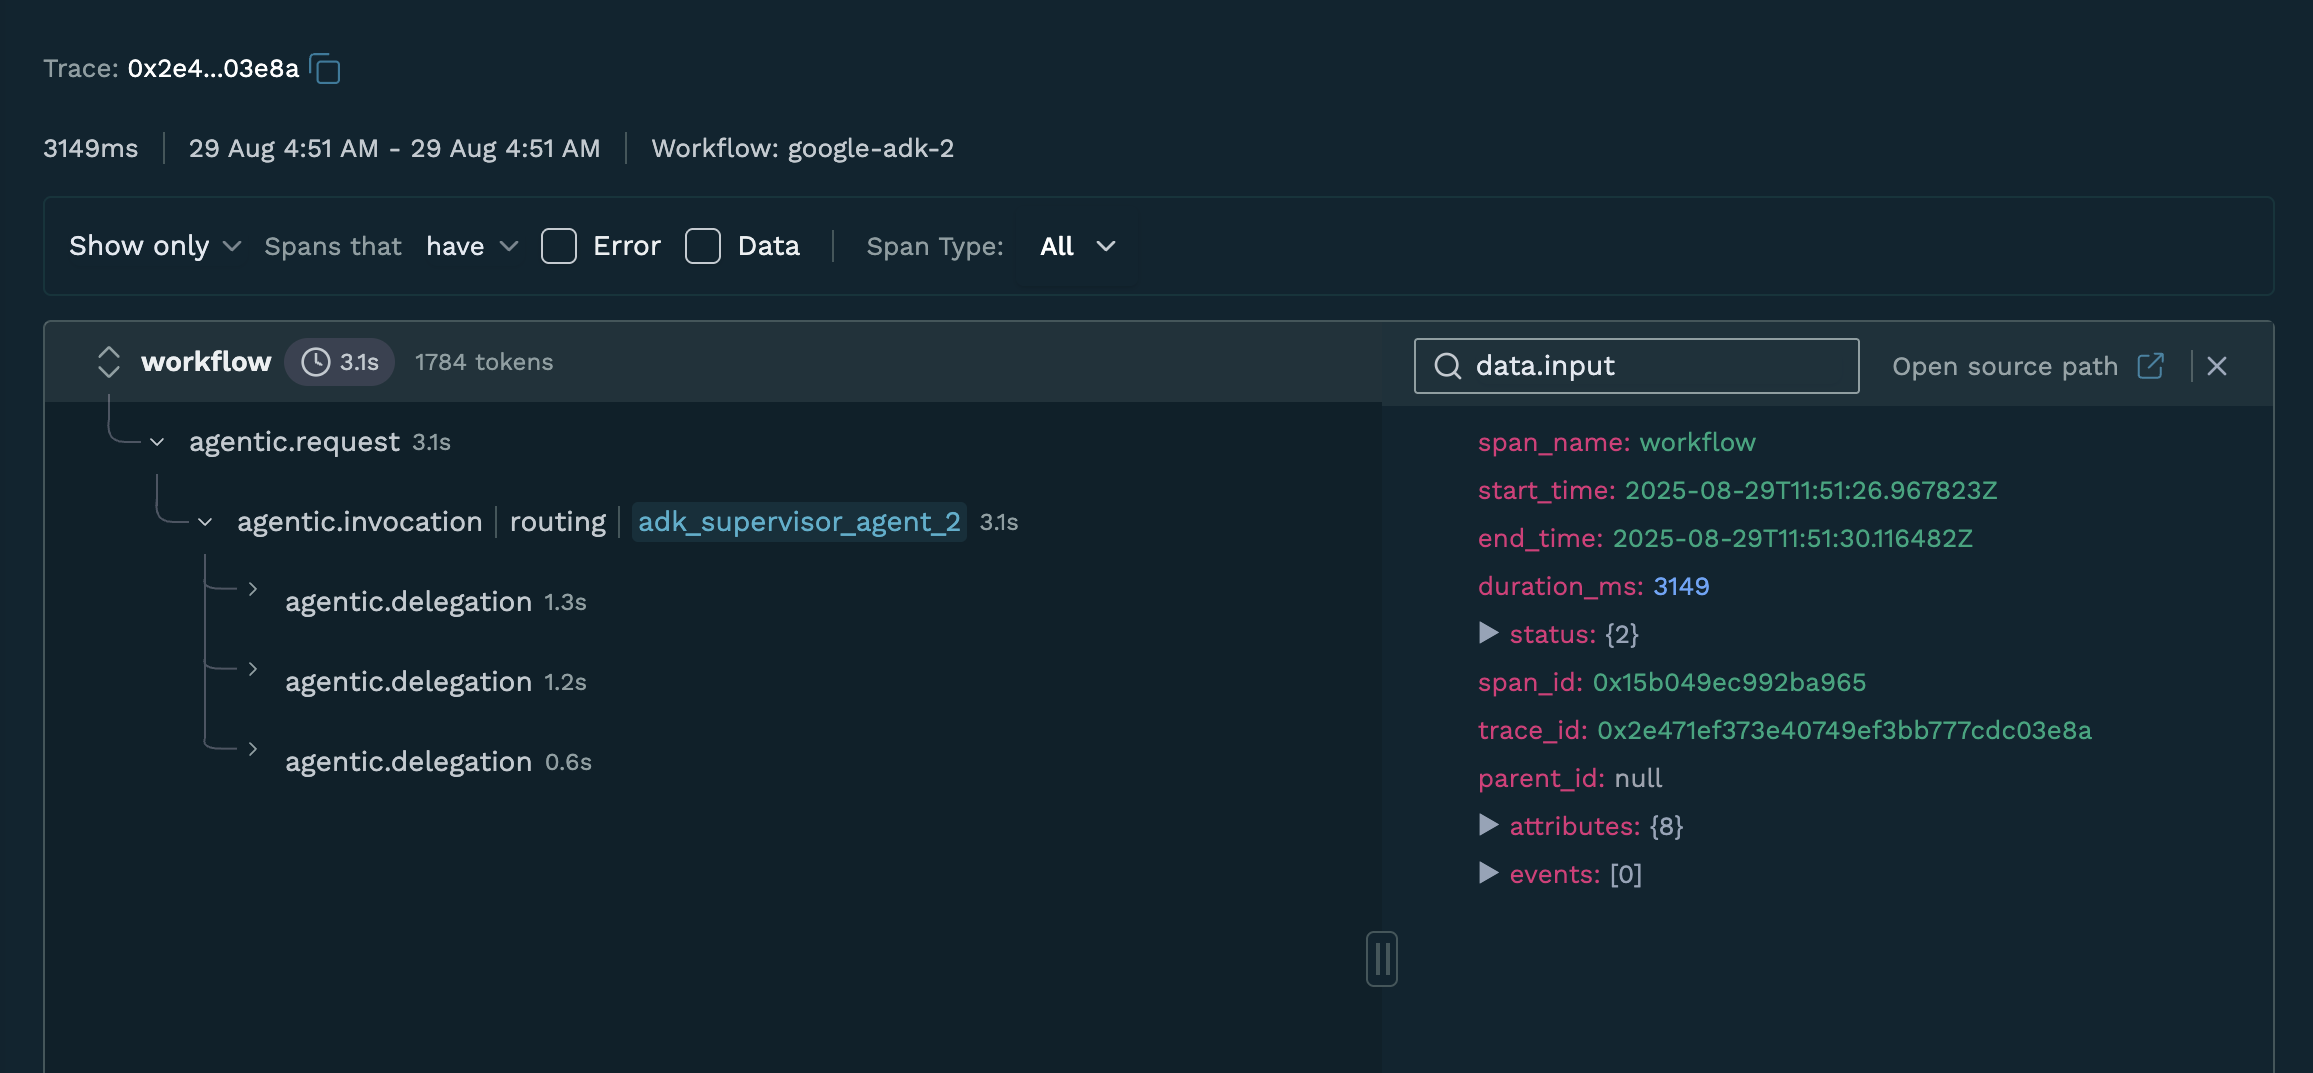
What you see:
- Left panel -- Collapsible span tree showing the execution hierarchy
- Right panel -- Span details (click any span to inspect it)
- Header bar -- Trace ID, workflow name, start/end times, total duration
Each span shows:
- Span type (e.g.,
agentic.invocation,inference,agentic.tool.invocation) - Duration (e.g.,
3.1s) - Entity info (agent name, model name, tool name)
- Status indicators
Filtering options (top bar):
- Show only dropdown -- Filter by span relationship
- Spans that have -- Filter criteria
- Error checkbox -- Show only error spans
- Data checkbox -- Show only spans with data
- Span Type dropdown -- Filter by specific span type (e.g., inference, tool call)
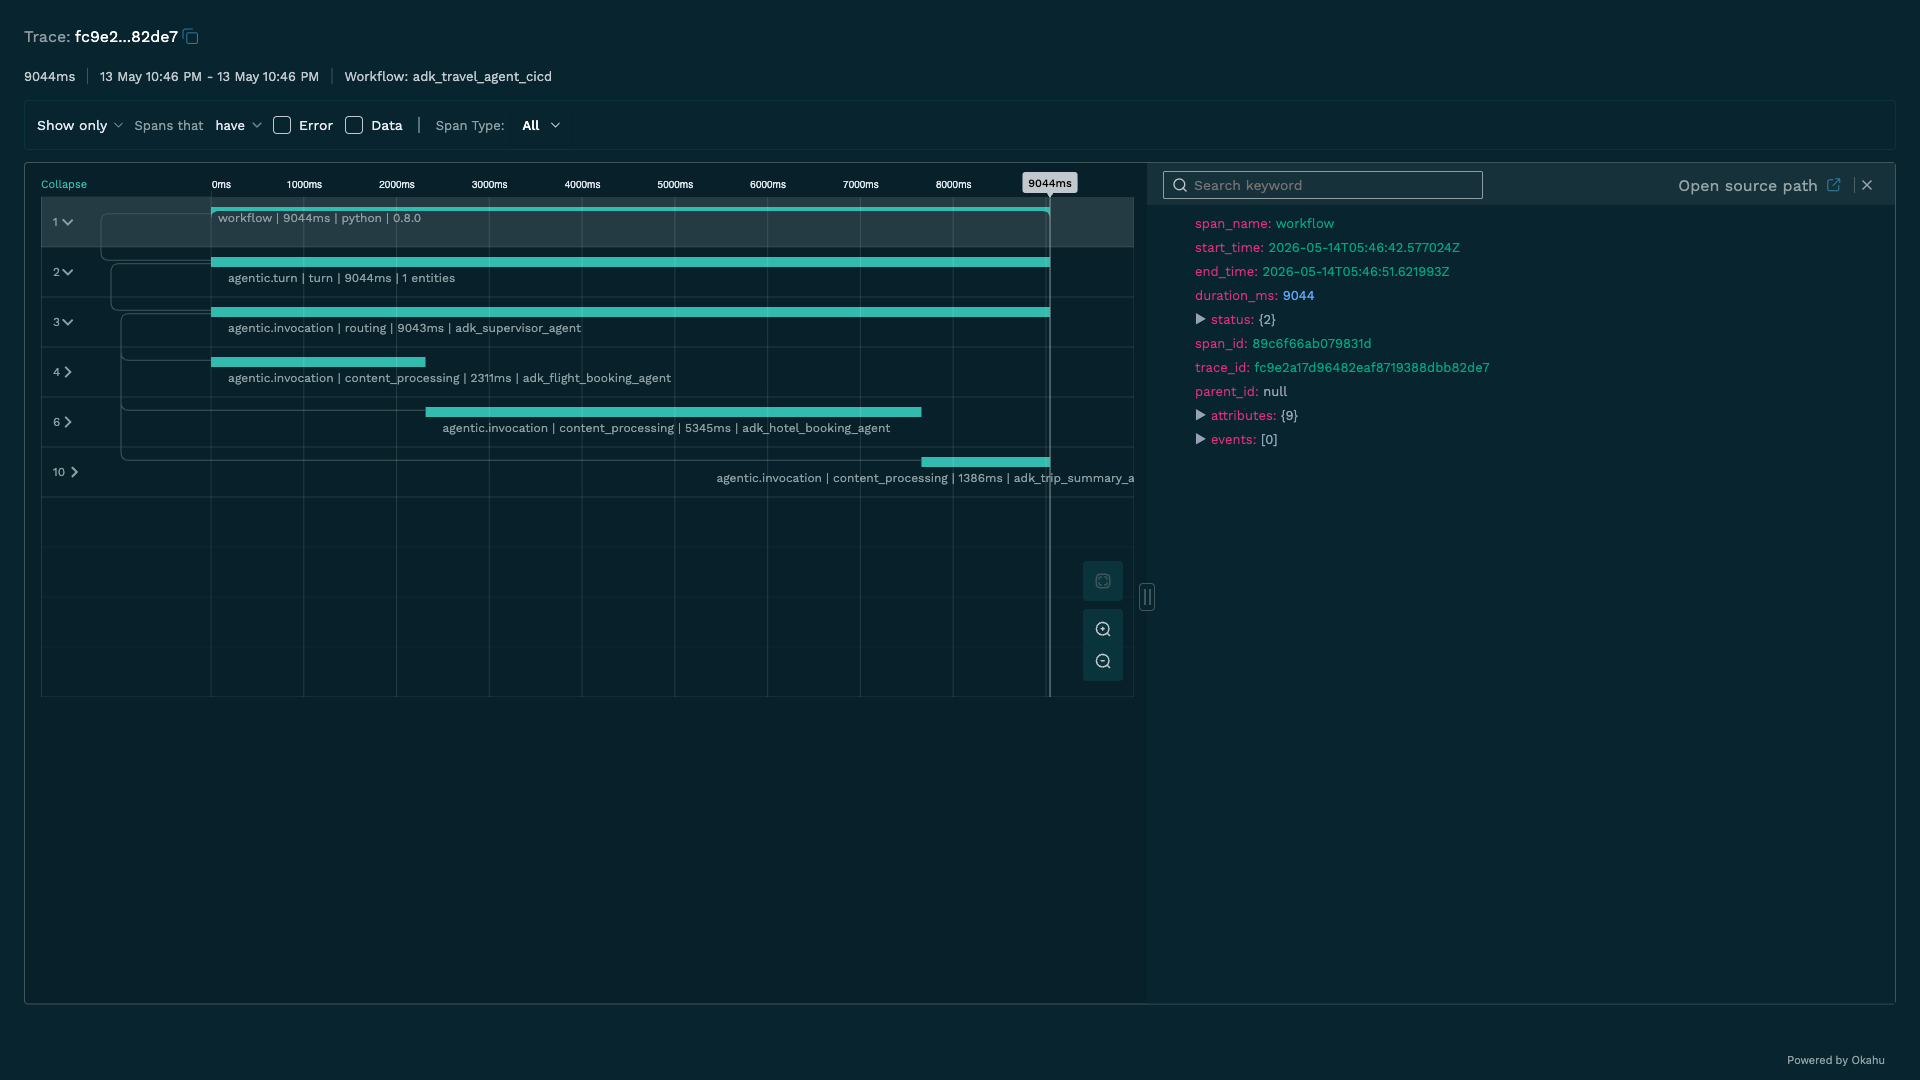
Gantt View
Timeline visualization showing when each span started and how long it ran. Useful for identifying performance bottlenecks and understanding parallelism.
Features:
- Horizontal bars scaled to actual duration
- Color-coded: teal for success, coral red for errors
- Zoom in/out controls
- Pan/drag to navigate the timeline
- Expand/collapse grouped spans
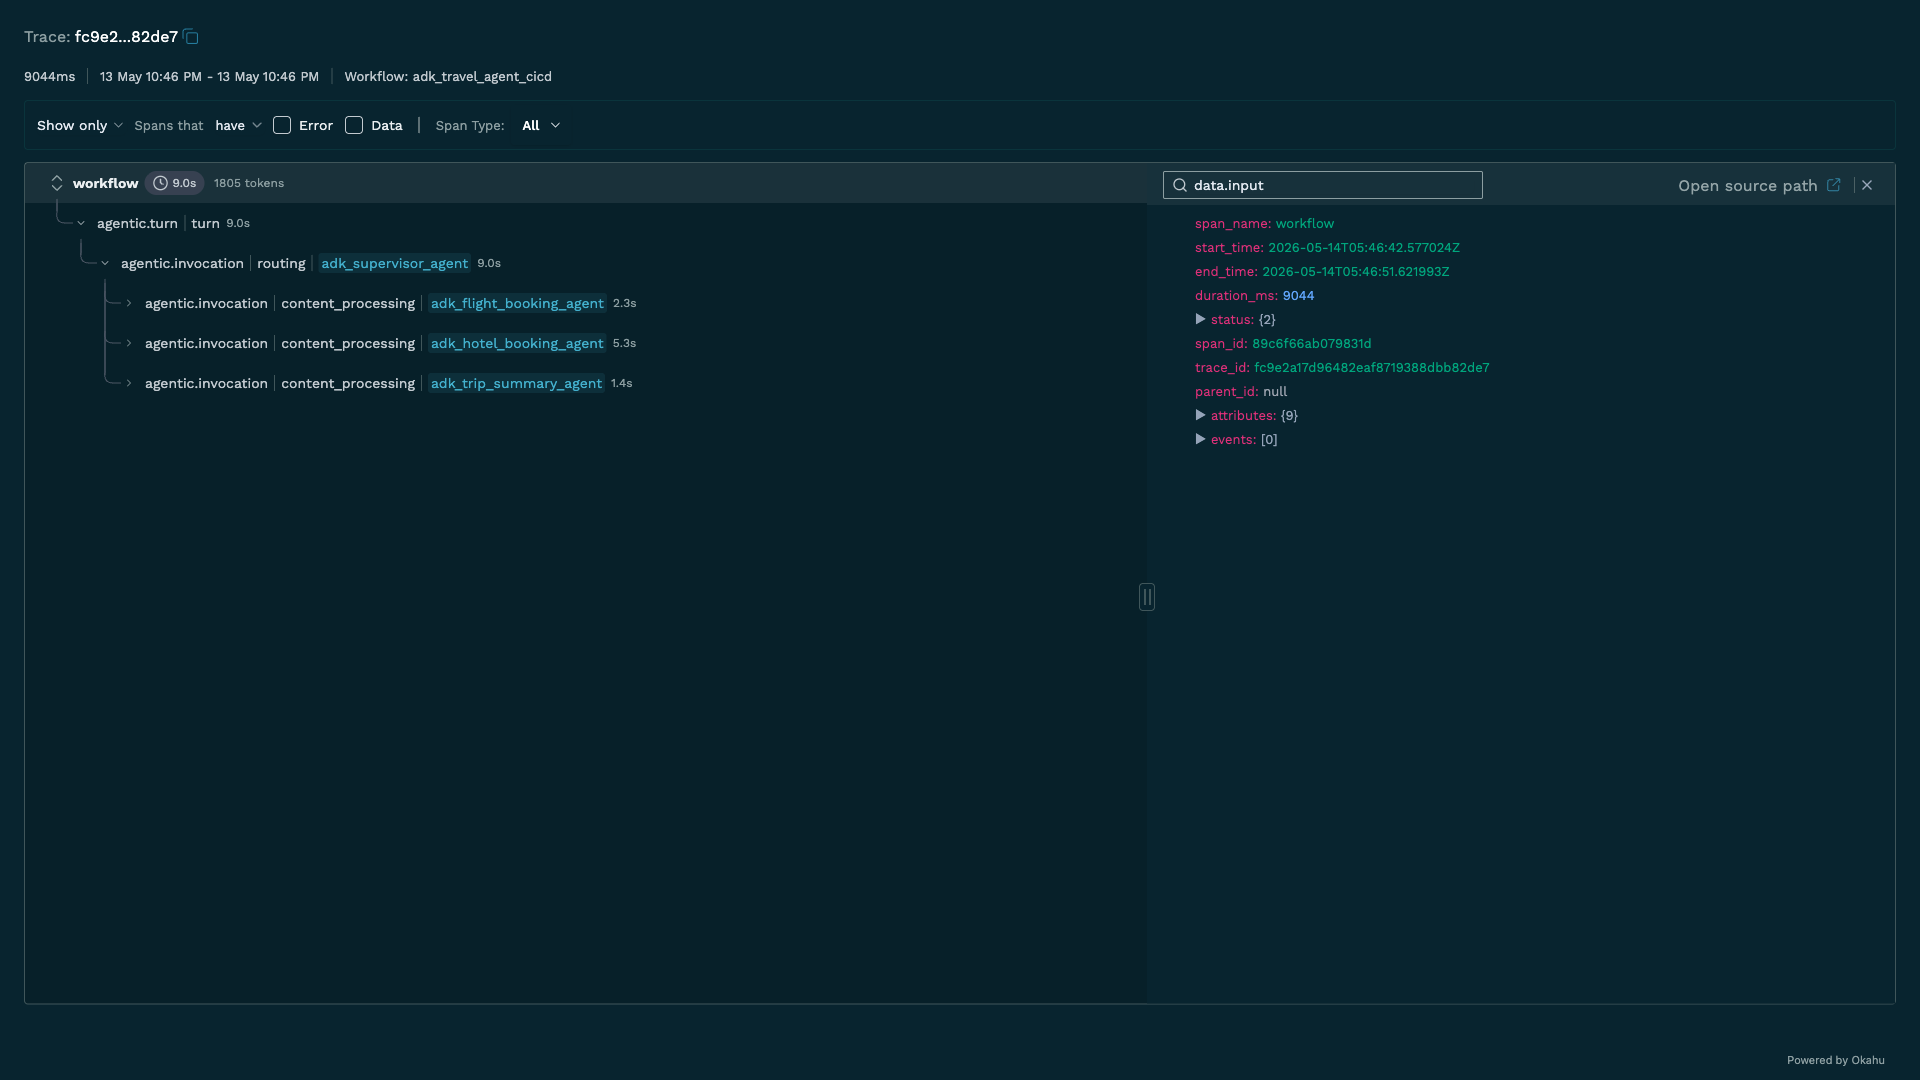
Narrative Graph View
Available for cloud traces only. Shows the agentic conversation flow as an interactive graph diagram.
Features:
- Turn-based visualization of agent interactions
- Expandable/collapsible turn nodes
- Visual flow of agent delegation and tool calls
- Interactive graph with zoom and pan
Connecting to Cloud Traces
Click the Add Cloud button (cloud icon with +) in the TRACES toolbar to connect to remote trace storage.
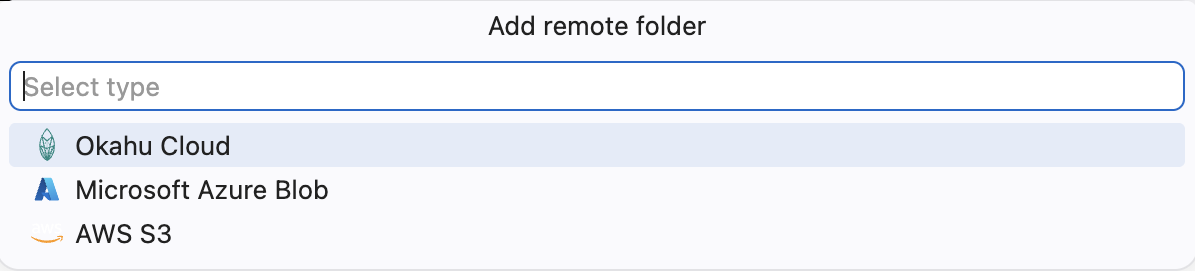
Three providers are supported. See the detailed setup guide for each:
| Provider | Best For | Guide |
|---|---|---|
| Okahu Cloud | Managed traces + evaluations | Connect to Okahu Cloud |
| AWS S3 | Traces stored in S3 buckets | Connect to AWS S3 |
| Azure Blob | Traces stored in Azure Blob Storage | Connect to Azure Blob |
All credentials are stored securely in your OS keychain (macOS Keychain, Windows Credential Manager, or Linux libsecret) via VS Code's SecretStorage API.
Chat Agent (@okahu)
Open VS Code Chat (Cmd+Shift+I / Ctrl+Shift+I) and type @okahu to interact with the AI-powered trace analysis agent.
Commands
@okahu /error -- Find Error Spans
Analyzes error spans across your local or cloud traces.
What it does:
- Scans traces for spans with ERROR status
- Extracts error messages, stack traces, and context
- Generates an LLM-powered summary per trace
- Provides a cross-trace error analysis identifying patterns
@okahu /performance -- Find Slowest Spans
Identifies performance bottlenecks across your traces.
@okahu /performance which trace had the slowest database call?
@okahu /performance analyze latency in the last 10 traces
What it does:
- Finds the top 2 slowest spans per trace by duration
- Reports span names, durations, and parent context
- Provides LLM-powered analysis of bottlenecks and optimization suggestions
@okahu /evaluate -- Run LLM Evaluations
Runs evaluation criteria against cloud traces. See Running Evaluations for the full workflow.
@okahu /evaluate run sentiment evaluation on the last 3 traces
@okahu /evaluate check relevance for trace abc123
@okahu /help -- Command Reference
Shows the full command reference with usage examples.
General Questions
Ask naturally without a command prefix. Okahu determines the scope and analyzes your traces:
Running Evaluations
Evaluations let you assess LLM responses in your cloud traces using criteria like sentiment, relevance, or custom checks. Evaluations require Okahu Cloud -- they are not available for local traces or AWS S3/Azure Blob traces.
Prerequisites
- An Okahu Cloud connection (see Connect to Okahu Cloud)
- Your
OKAHU_API_KEYstored in the extension (set up automatically during cloud connection) - The API key is also written to
.env.monoclein your workspace root asOKAHU_API_KEY=...for local SDK use
Running an Evaluation via Chat
Use @okahu /evaluate in VS Code Chat. The wizard guides you through these steps:
Step 1: Specify scope
Tell Okahu what to evaluate:
@okahu /evaluate run sentiment evaluation on the last 3 traces
@okahu /evaluate check relevance for trace fc9e2a17d96482eaf8719388dbb82de7
Okahu resolves your tenant, workflow, and traces from the cloud.
Step 2: Select evaluation templates
The extension fetches available evaluation criteria from the Okahu backend and asks you to confirm. You can select up to 5 criteria per evaluation run.
Available criteria depend on your account but commonly include:
- Sentiment -- Is the LLM response positive, negative, or neutral?
- Relevance -- Is the response relevant to the user's query?
- Custom criteria -- Defined in your Okahu Cloud account
You can describe your goal naturally (e.g., "check if responses are on-topic") and Okahu matches it to the right template.
Step 3: Confirm configuration
Okahu shows a summary of what will be evaluated:
- Workflow name
- Tenant name
- Fact type (traces, inferences, or web requests)
- Selected criteria
You can edit the workflow, criteria, or cloud account before proceeding.
Step 4: Start evaluation
Click Start Evaluation. Okahu submits evaluation jobs to the backend, one per selected template.
Step 5: View results
Results stream back into the chat with:
- Trace ID (clickable -- opens the trace)
- Label -- e.g., "positive", "negative", "neutral", "on_topic"
- Explanation -- Why the label was assigned
- Score -- Numeric score (when applicable)
Running an Evaluation via the Webview
When viewing a cloud trace in the webview panel, click the Evaluate button in the header bar. This opens the same evaluation wizard.
Evaluation Badges
After evaluation, traces display colored eval badges in the webview:
- Green -- Positive results (positive, on_topic, ok)
- Red -- Negative results (negative, off_topic, frustrated)
- Gray -- Neutral results
Hover over a badge to see the criteria name, timestamp, and full explanation.
Supported Fact Types
Evaluations can target different levels of trace data:
| Fact Type | What It Evaluates |
|---|---|
| Traces | Root trace spans (default) |
| Inferences | Individual LLM inference calls |
| Web Requests | HTTP request spans |
Select the fact type during the Okahu Cloud connection setup or when editing your workflow configuration.
Span Details
Click any span in the tree or Gantt view to open the details panel on the right.
Information shown:
span_name-- The operation name (e.g.,google.genai.models.AsyncModels.generate_content)start_time/end_time-- Timestampsduration_ms-- How long the span tookstatus-- OK or ERRORspan_id/trace_id/parent_id-- Trace context identifiersattributes-- All span attributes as expandable JSON- Agent name, model name, provider
- Span type (
inference,agentic.invocation,agentic.tool.invocation) - Entity details (inference endpoints, model versions)
- Token counts, session/turn/invocation IDs
events-- Input/output data and metadatadata.input-- What was sent to the LLM/tooldata.output-- What came backmetadata-- Token counts (prompt, completion, thoughts), finish reason
Search: Use the search box in the details panel to find specific attributes across the span JSON. The "Open source path" button jumps to the source code location that generated the span.
Example: ADK Travel Agent Trace
A real multi-agent trace from a Google ADK travel agent that orchestrates flight booking and hotel booking sub-agents.
All Commands
Open the Command Palette (Cmd+Shift+P) and type "Okahu" to see all available commands:
| Command | Description |
|---|---|
| View: Show Okahu AI Observability | Open the extension sidebar |
| Focus on TRACES View | Jump to the TRACES panel |
| Focus on HOME View | Jump to the HOME panel |
| Enable Monocle for Python | Add Monocle instrumentation to a Python file |
| Enable Monocle for TypeScript | Add Monocle instrumentation to a TypeScript file |
| Run Python with Monocle | Run the current Python file with tracing enabled |
View Toolbar Buttons
| Button | Description |
|---|---|
| Add Cloud (+ cloud icon) | Connect to Okahu Cloud, AWS S3, or Azure Blob |
| Tree View | Switch to hierarchical span tree |
| Gantt View | Switch to timeline visualization |
| Narrative View | Switch to graph visualization (cloud traces) |
| Refresh | Reload all traces |